 |
Monthly doses of effective UV irradiance |
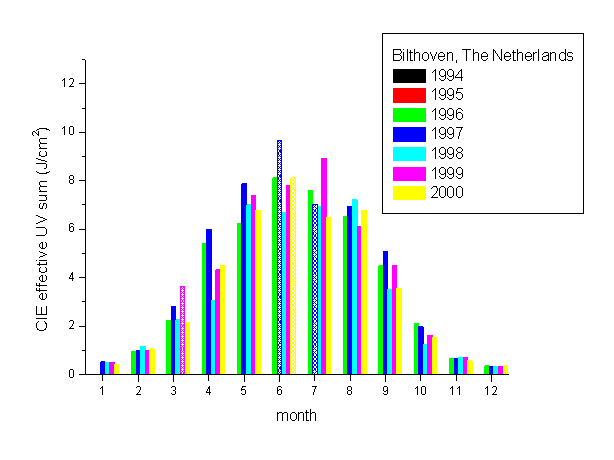 Bilthoven |
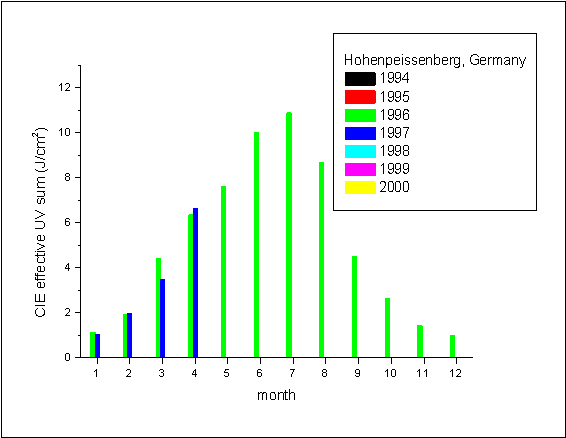 Hohenpeissenberg |
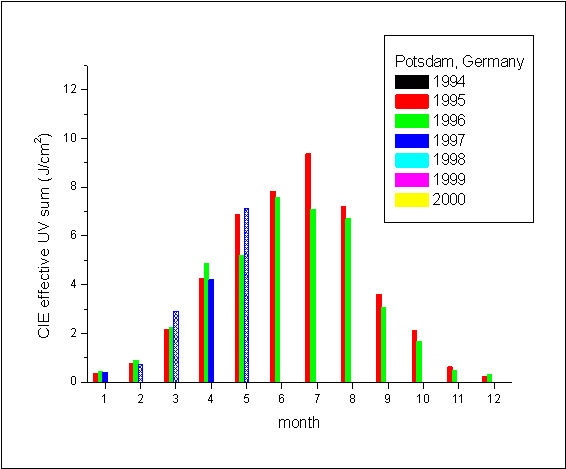 Potsdam |
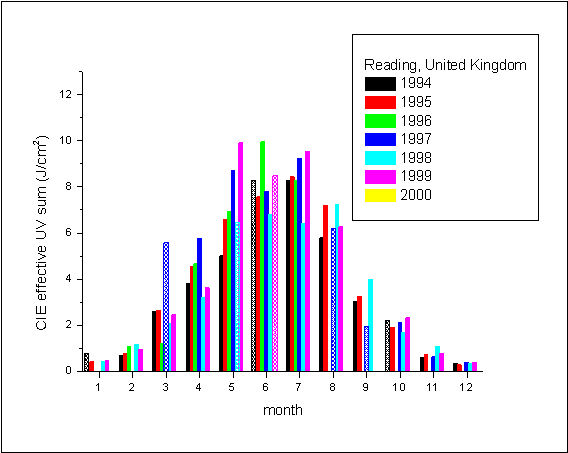 Reading |
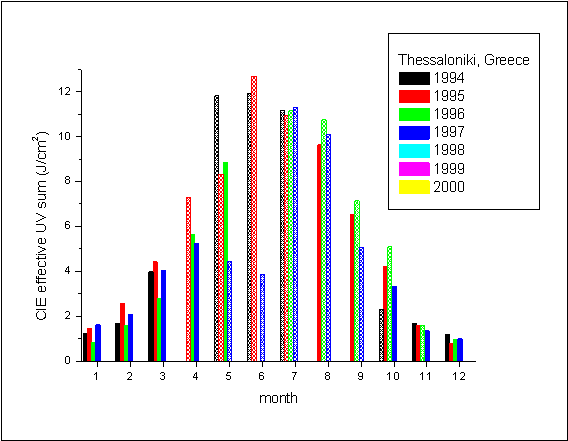 Thessaloniki |
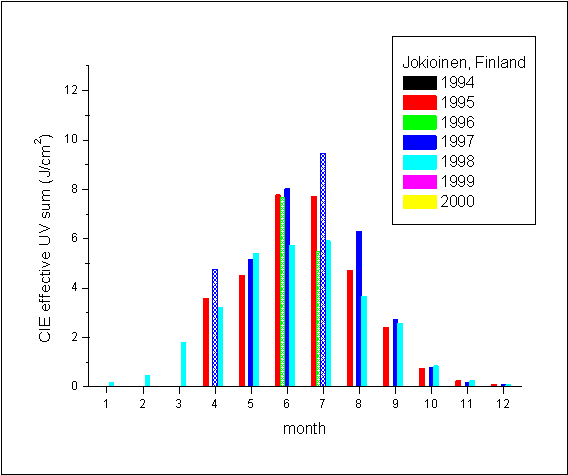 Jokioinen |
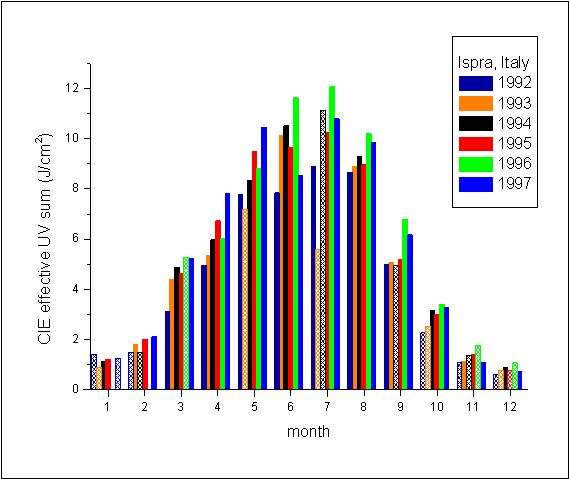 Ispra |
| |
Monthly doses of effective UV irradiance |
|
Bilthoven |
Hohenpeissenberg |
Potsdam |
Reading |
|
Thessaloniki |
Jokioinen |
Ispra |